When the visual argument is TRUE, returns the results of
a call to SSO_estimate() as a ggplot.
When visual is FALSE, returns a list of the min, most probable,
and max values for both the SSO and the client.
Usage
SSO_graph_plot(
  SSO_out,
  cert = 0.95,
  visual = TRUE,
  plot_prior_SSO = FALSE,
  plot_posterior_SSO = TRUE,
  plot_prior_client = FALSE,
  plot_posterior_client = TRUE,
  min_prob = 1.5
)
Arguments
- SSO_out
The output of a call to
SSO_estimate().- cert
The one sided certainty level for the min and max values of the error fraction. Default 0.95.
- visual
If
TRUE, a plot is returned. IfFALSE, a list of specific values is returned. DefaultTRUE.- plot_prior_SSO
If
TRUE, the prior probability curve of the error fraction in the SSO transactions is plotted. Default isFALSE.- plot_posterior_SSO
If
TRUE, the posterior probability curve of the error fraction in the SSO transactions is plotted. Default isTRUE.- plot_prior_client
If
TRUE, the prior probability curve of the error fraction in the SSO transactions is plotted. Default isFALSE.- plot_posterior_client
If
TRUE, the posterior probability curve of the error fraction in the SSO transactions is plotted. Default isTRUE.- min_prob
The minimum probability to be shown in the plot.
Value
If
visualisTRUE, a ggplot is returned.If
visualisFALSE, a named list is returned consisting ofthe max, most probable, and min values of the error fraction for the prior and posterior of the client;
and ditto for the SSO
Details
When visual is TRUE a ggplot is returned which includes:
if
plot_prior_SSOisTRUE, the prior probability curve of the error fraction in the SSO transactionsif
plot_posterior_SSOisTRUE, the posterior probability curve of the error fraction in the SSO transactionsif
plot_prior_clientisTRUE, the prior probability curve of the error fraction in the client transactionsif
plot_posterior_clientisTRUE, the posterior probability curve of the error fraction in the client transactions
The text in the plot shows the rounded of values of the min, most probable, and max values for both the SSO and the client.
When visual is FALSE, a list of the min, most probable,
and max values for both the SSO and the client are returned.
In that case the raw values of min, most probable, and max are returned,
so no rounding is done.
Examples
# We copy the examples for SSO_estimate() here and call SSO_graph_plot()
# on the result.
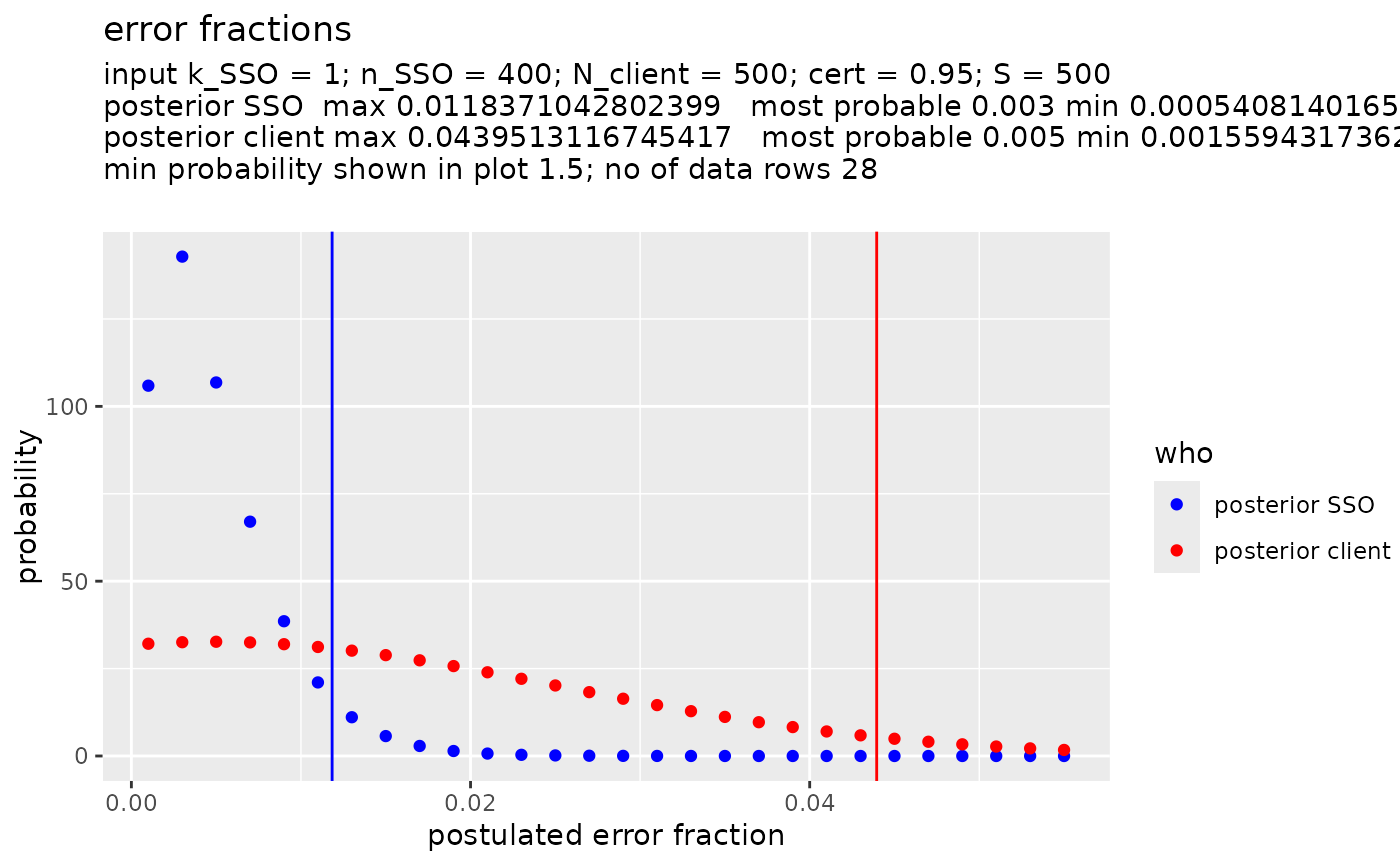
# Simple situation with flat priors.
x1 <- SSO_estimate(k_SSO = 1,
n_SSO = 400,
N_client = 500,
S = 500)
SSO_graph_plot(x1)
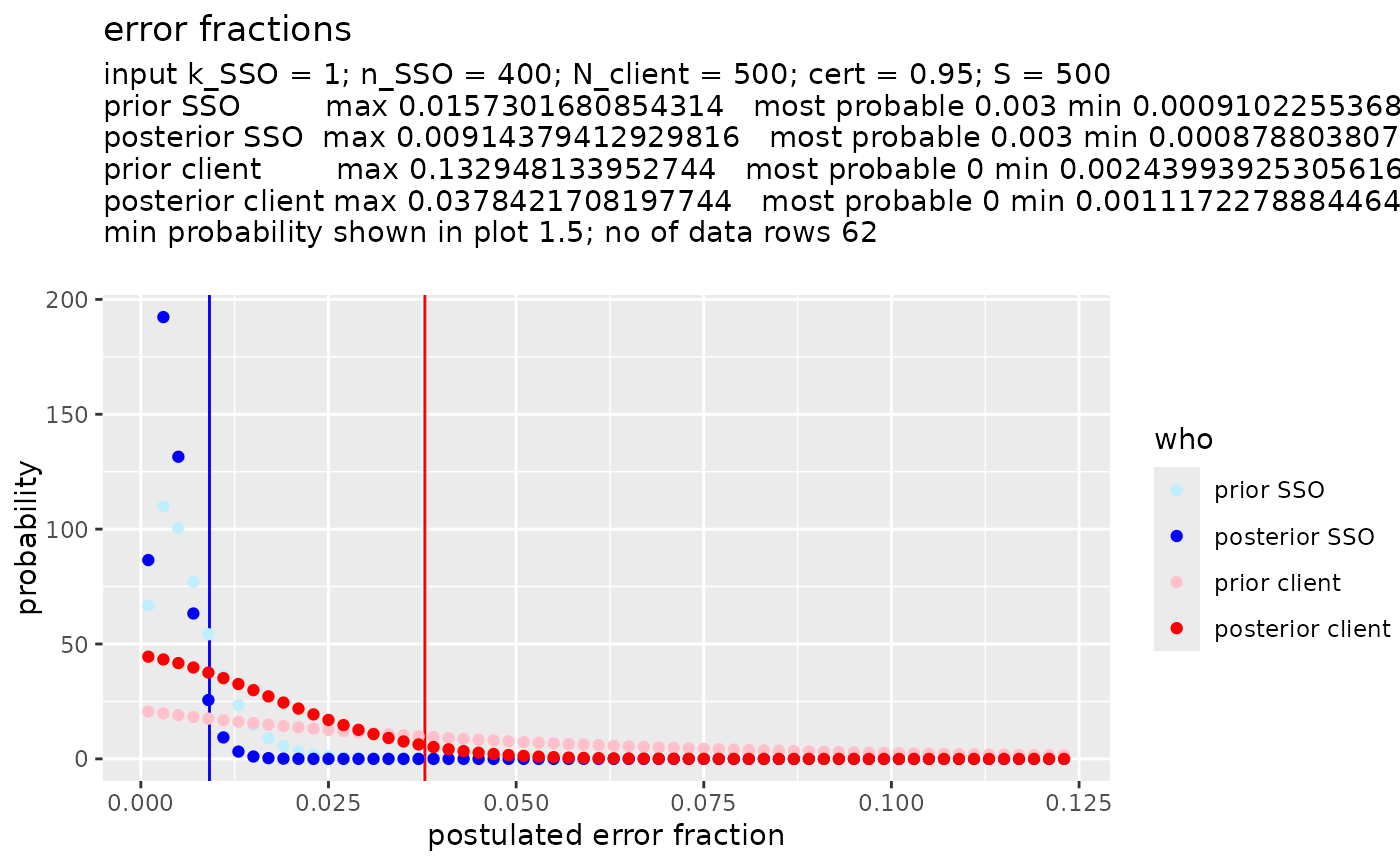
 # More complex situation with non flat priors.
# Prior for the whole of SSO transactions e.g. based on what we found
# in a random survey last year.
fun_prior_SSO <- function(p) {dbinom(1, 300, p)}
# Prior for client e.g. result of preliminary investigations of client transactions.
fun_prior_client <- function(p) {dbinom(0, 20, p)}
x2 <- SSO_estimate(fun_prior_SSO = fun_prior_SSO,
k_SSO = 1,
n_SSO = 400,
fun_prior_client = fun_prior_client,
N_client = 500,
S = 500)
SSO_graph_plot(x2, plot_prior_SSO = TRUE, plot_prior_client = TRUE)
# More complex situation with non flat priors.
# Prior for the whole of SSO transactions e.g. based on what we found
# in a random survey last year.
fun_prior_SSO <- function(p) {dbinom(1, 300, p)}
# Prior for client e.g. result of preliminary investigations of client transactions.
fun_prior_client <- function(p) {dbinom(0, 20, p)}
x2 <- SSO_estimate(fun_prior_SSO = fun_prior_SSO,
k_SSO = 1,
n_SSO = 400,
fun_prior_client = fun_prior_client,
N_client = 500,
S = 500)
SSO_graph_plot(x2, plot_prior_SSO = TRUE, plot_prior_client = TRUE)